 by Dave Olinger and Ernesto Wiedenbrug, Ph.D.
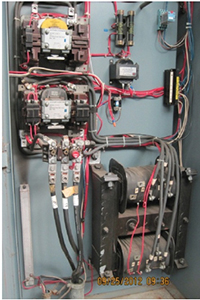
This paper discusses how voltage and current captures of motors starting at line frequency can be used to diagnose high resistance contact problems, and even detect whether these problems are up-stream or down-stream from where the measurements were taken [1-2]. These concepts are applied on startup transient captures of two 8-pole 100hp motors which are started via 80% reduced-voltage autotransformers (Fig. 1) [3]. One motor shows a high resistance contact below the point of measurement, and the other transient capture was used to diagnose a problem in the autotransformer, which has been verified to be shorts in the transformer.
To continue reading the full case study, with images, please download the free PDF file here.
http://csaanalysis.com/PDFS/Startup%20Transients%20for%20Reduced%20Voltage%20Starts.pdf
To contact Whitelegg direct please visit http://www.whitelegg.com
 Ernesto Wiedenbrug, Ph.D.
Description:
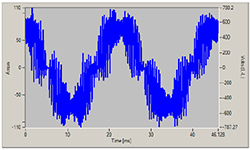
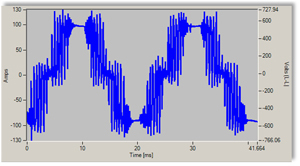
The voltage waveform to the left in Fig 1 looks normal, but at another point in time it looks like the waveform to the right of Fig. 1; where the waveform stays constant on the top and the bottom. What is going on? Is this a problem?
Fact:
VFDs don’t only change the frequency of the voltage, but also the voltage level in proportion with the frequency.
Comparing the frequencies:
Both plots show two complete cycles for the voltage waveforms; the one to the left takes 46.1ms for two cycles – which means 43.4Hz, and the one to the right takes only 41.7ms, which means that the VFD is running at 48Hz. According to the Volts per Hertz control technique [1], this means that the VFD output voltage needs to be almost 10% higher for the waveform to the right.
To continue reading the full case study, with images, please download the free PDF file here.
http://csaanalysis.com/PDFS/FAQ%20-%20what%20does%20it%20mean%20if%20the%20voltage%20waveform%20generated%20by%20a%20VFD%20has%20'flat%20spots'.pdf
To contact Whitelegg direct please visit http://www.whitelegg.com
 by Ernesto Wiedenbrug, Ph.D.
  Ernesto Wiedenbrug, Ph.D., SM IEEE,
 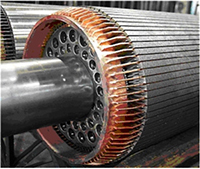 Ernesto J. Wiedenbrug, Ph.D., SM IEEE
  A new handheld laser optical alignment device has been launched that enables faster, easier alignment of shafts in rotating equipment such as fans, motors, pumps, gearboxes, ventilators and compressors.
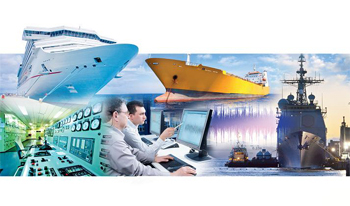 Condition monitoring (CM) has been used in the marine industry for many years, typically using data collectors operated by ship's staff. However, with the advent of larger, more complex machinery, particularly on vessels such as large LNG carriers, automated online CM systems have become more popular.