Vibration Monitoring - Statistics
Poincare Map and Phase Plane Behavior of Tracks Vibrations in Escalators
by Dr. Ali Albadri
Abstract
Rather than depending on the conventional procedure of understanding the behaviour of vibration signals by plotting them on the x and y axes, we sought the technique of determining the fractal dimension [1, 2] and the method of plotting the Poincare map as well as the Poincare phase plane. These methodologies shall unveil more about the nature of the measured signals, but more importantly, shall show whether the machine has a malfunction or not and where in the machine. Defining these will have a significant contribution to maintenance from the planning and resources point of view.
The Poincare map and the phase plane have been plotted for vibration signals measured from escalator tracks. The curves/attractors in the plot's small loops nest in specific areas in each plot, then large loops start to come out and then come back to each nest. The shape and pattern of each large loop reflect whether the machine is subjected to normal or abnormal operation conditions. The abnormal conditions could be generated from a malfunction in the machine.
Introduction
Phase portrait is an invaluable tool in studying dynamical systems, where it gives the geometrical representation of trajectories in the phase plane. They consist of a plot of typical trajectories in the state space. Each set of initial conditions is represented by a different curve or point. This reveals information such as whether an attractor, a Repeller or a limit cycle is present for the chosen parameter value.
Detecting the behaviour of machines have studied extensively by us in various publications and applications [3, 4, 5, 6, 7, and 8]. Similarly, the techniques of plotting the Poincare map or the Poincare phase plane have been tested in many investigations [9, 10, 11, and 12]. These studies involved monitoring the changes in stresses/strains, and temperature of the machine to explore the possibility of using the Poincare method in establishing the health of the machine, such as an escalator.
Mechanical machines are exposed to mechanical failures as each component and sub-assembly depends on its design, strength, location in the machine, fatigue life….etc. High load, high deflection, fatigue cycles, friction, wear…etc can contribute to degrading the performance of the machine components. Therefore, it is critical to diagnose and predicate those failures to keep the machine as intended or designed.
There has been increasing interest in fault diagnosis of mechanical machines [13]. Such diagnosing techniques involve collecting vibration or acoustic signals for analysis [15 and 15]. Signal processing and analysis have been a popular research area in fault diagnosis [16].
Vibrations of strings and beams have been investigated by Wick & Mote [17, and 18]. Suweken and Van Morssen [19 and 20] studied transversal vibrations of a conveyor belt with low and time-varying velocity.
Vibration Data Collection
Vibration sensors were distributed at different location on the tracks, as shown in Figure 1. The data/traces were logged into a data logger, see Figure 2, then down load on a computer for analysis. The period of run was divided into three regions, region 1, 2 and 3. The three regions do not include a region of shut down as shown in Figure 2.

Figure 1 Shows escalator tracks layout and the locations of the vibration sensors.
Methodology of Plotting Poincare Map and Poincare Phase Plan
The 2D Poincare space map and the 3D Poincare phase plane are constructed by using the pseudo-phase plane method (also called the embedding space method). For one degree of freedom system with measurement x(t), one plots the signal versus itself but delayed or advanced by fixed time constant [x(t), x(t+T)]. The idea is that the signal x(t+T) is related to x`(t) and should have properties similar to those in the classic phase plane [x(t), x`(t)]. If the motion is chaotic, the trajectories do not close.
.Figure 3 presented a magnification view to region 1, 2 and 3 in Figure 2.
|
Region 3 |
|
Region 2 |
|
Region 1 |

Figure 2 Presents the vibrations readings against the running time.

Figure 3a A magnification view for region 1 (0-2500 second) in Figure 2.

Figure 3b A magnification view for region 2 (2500-4000 second) in Figure 2.

Figure 3c A magnification view for region 3 (7700-10000 seconds) in Figure 2.
Results and Discussion
The Poincare maps (2D plot) and the phase plane (3D plot) have been plotted in sequence for the left and right-hand tracks as shown in Figures 4, 5, 6 and 7. In general, the figures show an intense dense accumulation of small loops in one area in the plot. The line which forms these loops is the attractor of the space of the system. The intense nest of loops consists of small loops overlaid on top of each other. Larger loops emanate from and return to the nest to form separate well-defined patterns. These loops can reflect the operational nature of the machine during normal and abnormal operations.
A systematic and careful approach will be adopted to recognise and compare the characteristics of the behaviour of the attractors in the 2D and the 3D plots, these characteristics are:
- The size/range of the nest of loops (size of the area in the plot).
- The size/range of the large loops.
- Number of the large loops which start and end in the nest of the small loops.
- The shapes and patterns of disruption in the loops of the small nest.
- The shapes and patterns of disruption in the large loops.
- The uniform, repeatable, systematic large loops represent the normal operation condition of the escalator. Any disruption to the uniform shape of these loop suggest that the machine is subjected to abnormal operation conditions.
In a previous study [1], see Table 1, the fractal dimension values have a quantitative difference in the region of 0.01, between the vibration signals of the tracks which produced high fractal dimension values and the vibration signals of the tracks which produced low fractal dimension values. In all the operation regions, the right hand, RH, chain track, and the left hand, LH, trailer track have higher fractal dimension values than the RH trailer track and LH chain track.
Figure 4 for the LH trailer track presents that in the ranges 1 and 2 the attractor fluctuates in the frequency between the values 0.01 and 0.015Hz. But in range 3, the fluctuation becomes larger, between the values 0.024 and 0.12Hz. The attractors of all the other sensors fluctuate between 0.008 and 0.09Hz.
The abnormality in the shapes of the large loops in Figures 4c1 and c2, manifested in similar shapes but at a smaller range of frequencies.
The findings in this study agree with the fractal dimension values [1], but not quite. The plots and their range values suggest that the source of abnormal vibration is the LH trailer track, therefore, it can safely said that plotting the Poincare map and phase plane has helped in pinpointing exactly where is the source of the fault in the machine.
Conclusions
We believe that the Poincare map and phase plane methods as well as determining the fractal dimension are useful tools in assessing the conditions of mechanical machines such as an escalator. They assist in showing the machine's behaviour without or with a malfunction. The 2D map and 3D phase plane plots generated from vibration signals are useful and interesting tools for monitoring the behaviour of the machine.
The general pattern of each plot is that it has dense accumulated loops of the attractor bath centred in one area in the plot. From that nest of loops, uniform and un-uniform loops are starting and returning to the nest. The shape of these large loops can be correlated to the conditions and health of the machine. Un-uniform loops suggest that the machine has a malfunction similar to what we obtained in this study.
In addition to monitoring and understanding the topography of the 2D and 3D plots, it is also important to notice the ranges and scales of the loops/attractors along the axes. For example, Table 2, lists the ranges of each attractor in each plot. The values suggest that the source of the abnormal signal is the LH track. This finding endorses the finding that we concluded when we assessed the values of the fractal dimension for the signals [1]. In fact, the 2D and 3D plots with their ranges have shown greater accuracy than the fractal dimension values.
We have found that margining the techniques of determining the fractal dimension with the Poincare plots can play a significant role in understanding the behaviour of machines. They are useful in establishing the normal and abnormal operation conditions of the machine.
Lastly, it is important to compare the general topography of the behaviour of the attractors in all the figures. The attractors are more un-uniform and have many large loops in region 3 comparing to the regions 1 and 2. The most significant changes can be seen in the attractors for the RH track.
We can admit with confidence that the proposed methodologies in this paper are much more useful than just plotting the conventional way of studying measurement/signals/traces by just plotting them on the x and y axes. The discussed methodologies give clear and embedded detection of what is going on in the machine.
|
No |
Temperature Trace Type |
Fractal Dimension value, Df (0.0-2500s) |
Fractal Dimension value, Df (2500-4000s) |
Fractal Dimension value, Df (7700-10000s) |
|
1. |
LH trailer track |
1.434 |
1.434 |
1.434 |
|
2. |
RH trailer track |
1.428 |
1.428 |
1.428 |
|
3. |
LH chain track |
1.429 |
1.429 |
1.429 |
|
4. |
RH chain track |
1.432 |
1.431 |
1.432 |
Table 1 Lists the values of the fractal dimensions for the four tracks.
|
Location in machine |
Time range, seconds |
X-axis |
Y-axis |
Z-axis |
|||
|
2D |
3D |
2D |
3D |
2D |
3D |
||
|
LH track |
0-2500 |
0.01-0.019 |
0.01-0.019 |
0.011-0.018 |
0.011-0.018 |
X |
0.01-0.017 |
|
2500-4000 |
0.01-0.015 |
0.01-0.015 |
0.011-0.015 |
0.011-0.015 |
X |
0.01-0.015 |
|
|
7700-10000 |
0.006-0.015 |
0.006-0.015 |
0.007-0.015 |
0.007-0.015 |
X |
0.024-0.12 |
|
|
RH track |
0-2500 |
0.01-0.13 |
0.01-0.13 |
0.01-0.13 |
0.01-0.13 |
X |
0.01-0.13 |
|
2500-4000 |
0.01-0.14 |
0.01-0.14 |
0.01-0.14 |
0.01-0.14 |
X |
0.025-0.15 |
|
|
7700-10000 |
0.01-0.12 |
0.01-0.12 |
0.01-0.12 |
0.01-0.12 |
X |
0.025-0.12 |
|
|
LH chain |
0-2500 |
0.008-0.08 |
0.008-0.08 |
0.008-0.08 |
0.008-0.08 |
X |
0.02-0.08 |
|
2500-4000 |
0.008-0.08 |
0.008-0.08 |
0.008-0.09 |
0.008-0.09 |
X |
||
|
7700-10000 |
0.004-0.08 |
0.004-0.08 |
X |
||||
|
RH chain |
0-2500 |
0.01-0.07 |
0.01-0.07 |
0.01-0.07 |
0.01-0.07 |
X |
0.01-0.07 |
|
2500--4000 |
0.01-0.18 |
0.01-0.18 |
0.01-0.18 |
0.01-0.18 |
X |
0.01-0.18 |
|
|
7700-10000 |
0.005-0.06 |
0.005-0.06 |
0.01-0.07 |
X |
0.005-0.07 |
||
Table 2 Lists the ranges of the attractors for each vibration signals.
References
[1] A. Albadri. “Temperature Fractal and Nonlinear Behavior for Escalators, Lift & Escalators Symposium 14th Sept. 2023.
[2] A. Albadri. “Fractal and Nonlinear Behavior of Tracks Vibrations in Escalators”, to be published.
[3] Escalators Fractal Behavior (part 1). Elevator World, 2021, Oct.
[4] Escalators Fractal Behavior (part 2). Elevator World, 2021, Nov.
[5] Escalators Fractal Behavior (part 3). Elevator World, 2021, Dec.
[6] Escalators Fractal Behavior (part 4). Elevator World, 2022, Feb, pp. 60-61.
[7] Escalators Fractal Behavior (part 5). Elevator World, 2022, Marc.
[8] Fractal and Nonlinear Behavior of Track Vibration in Escalators. to be published.
[9] Temperature Phase Plan Map and Poincare Section for Escalators. to be published.
[10] The Construction of and Poincare Space Map Phase Plane Map for Escalators with Mechanical Fault (Part 1). Elevator World, 2022, iss. 110, pp. 66-59.
[11] The Construction of and Poincare Space Map Phase Plane Map for Escalators with Mechanical Fault (Part 2). Elevator World, 2022, iss. 111, pp. 56-69.
[12] The Construction of and Poincare Space Map Phase Plane Map for Escalators with Mechanical Fault (Part 3). Elevator World, 2022, iss. 112.
[13] Zhang D et all, “Wayside acoustic detection of train bearings based on an enhanced spline-kernelled chirplet transform”, J. Sound Vib. (2020).
[14] Zhaoh et all, “Roll angular rate extraction based on modified spline-kernelled chirplet transform”, Def Technol. (2022).
[15] Chen G et all, “ Frequency-temporal-logic-based fault diagnosis and fault interpretation using Bayesian optimization with Bayessian neual network”, Mech Syst Signal Process. (2020).
[16] Ozdemir M A et all, “ Hand gesture classification using time-frequency images and transfer learning based on CNN”. Biomed Signal Process Control, (2022).
[17] Wicket J. A. and Mote C. D., “Travelling load response of an axially moving string”, Journal of Sound & Vibration, (1991) 149, no. 2, 267-284.
[18] Wicket J. A. and Mote C. D., “Response & discretization methods for axially moving materials”, Applied Mechanics Reviews, (1991) 44, 279-284.
[19] Suweken G and Van Horssen W T, “On the weekly nonlinear, transversal vibrations of a conveyor belt with a low and time-varying velocity”, Nonlinear Dynamics. (2003) 31, no. 2, 197-223.
[20] Suweken G and Van Horssen W T, “On the transversal vibrations of conveyor belt with a low and time-varying velocity. Part II beam-like case, Journal of Sound and Vibration. (2003) 267, no. 5, 1007-1027.

Figure 4a1 Poincare map for the vibration of LH trailer tack between 0.0-2500 seconds.

Figure 4a2 Poincare phase plane for the vibration of LH trailer tack between 0.0-2500 seconds.

Figure 4b1 Poincare map of the vibration from LH trailer tack between 2500-4000 seconds.

Figure 4b2 Poincare phase plane of the vibration from LH trailer tack between 2500-4000 seconds.

Figure 4c1 Poincare map of the vibration from LH trailer tack between 7700-10000 seconds.

Figure 4c2 Poincare phase plane of the vibration from LH trailer tack between 7700-10000 seconds.
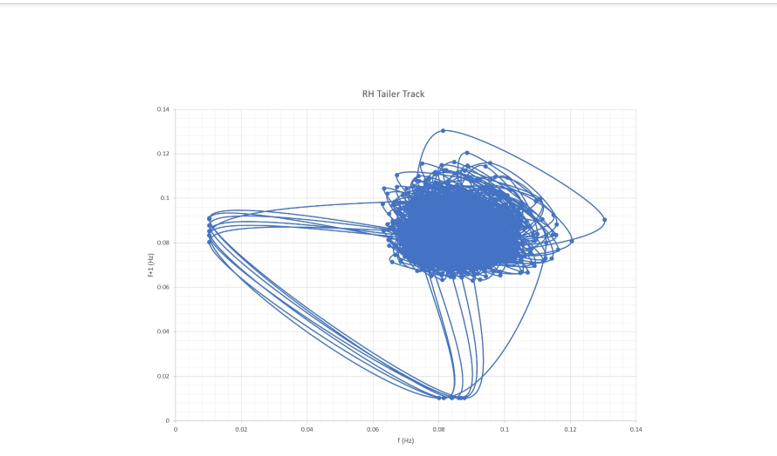
Figure 5a1 Poincare map for the vibration of RH trailer tack between 0.0-2500 seconds.

Figure 5a2 Poincare phase plane for the vibration of RH trailer tack between 0.0-2500 seconds.

Figure 5b1 Poincare map of the vibration from RH trailer tack between 2500-4000 seconds.

Figure 5b2 Poincare phase plane of the vibration from RH trailer tack between 2500-4000 seconds.

Figure 5c1 Poincare map of the vibration from RH trailer tack between 7700-10000 seconds.
Figure 5c2 Poincare phase plane of the vibration from RH trailer tack between 7700-10000 seconds.

Figure 6a1 Poincare map for the vibration of LH chain tack between 0.0-2500 seconds.
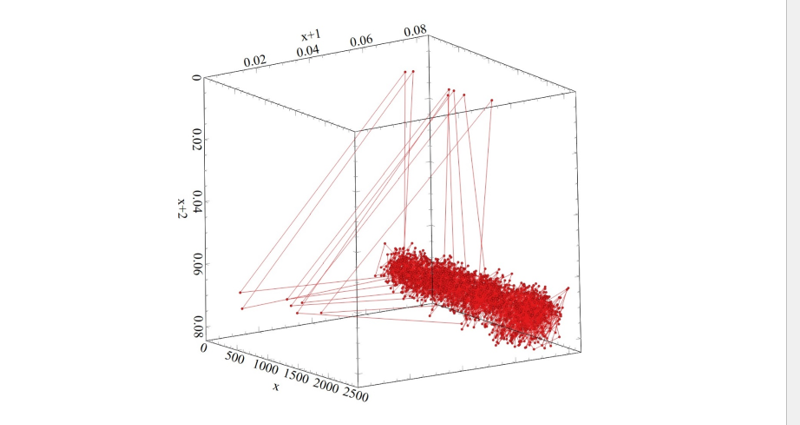
Figure 6a2 Poincare phase plane for the vibration of LH chain tack between 0.0-2500 seconds.

Figure 6b1 Poincare map of the vibration from LH chain tack between 2500-4000 seconds.

Figure 6b2 Poincare phase plane of the vibration from LH chain tack between 2500-4000 seconds.

Figure 6c1 Poincare map of the vibration from LH chain tack between 7700-10000 seconds.

Figure 6c2 Poincare phase plane of the vibration from LH chain tack between 7700-10000 seconds.

Figure 7a1 Poincare map for the vibration of RH chain tack between 0.0-2500 seconds.

Figure 7a2 Poincare phase plane for the vibration of RH chain tack between 0.0-2500 seconds.

Figure 7b1 Poincare map of the vibration from RH chain tack between 2500-4000 seconds.

Figure 7b2 Poincare phase plane of the vibration from RH chain tack between 2500-4000 seconds.

Figure 7c1 Poincare map of the vibration from RH chain tack between 7700-10000 seconds.

Figure 7c2 Poincare phase plane of the vibration from RH chain tack between 7700-10000 seconds.

Explore EMS
More Editorial
Directory
This website is owned and operated by: MSL Media Limited
Co. Number: 05359182
© 2005 MSL Media Ltd. All rights reserved. E&OE