Motors/Drives - Statistics
Temperature Phase Plan Map and Poincare Section for Escalators
Our interest in finding a tool which we can be used to understand and record the behavior of electro-mechanical machines is continuing in this study. We have chosen escalators in our studies because their natural electrical and systematic designs are based on systematic cyclic and periodic behavior. Escalator nature of operation has given us an excellent platform to determine how regular or irregular or chaotic the behavior of an escalator is, especially when some sort of malfunction develops in it. We used two tools to achieve our objectives [1-6], the fractal dimension concept and the phase plan map as well as the Poincare section.
In this study we will concentrate our efforts on the behavior of the gearbox which drives the escalator. The parameter which will be looked at is the temperature of the gearbox. Temperatures were measured from different locations in the gearbox. The phase plan maps and Poincare sections of various traces from various temperature sensors have been plotted, and they have presented some interesting and useful patterns. The plots can be used as reference maps for the normal and abnormal operating conditions of an escalator.
Introduction
In our previous studies, we have proven the fractal nature of escalator behavior during operation [1-6]. We plotted the phase plan map and the Poincare section for an escalator behavior [7,8,9]. There were useful and interesting patterns, they showed the patterns of stress level attractors in the machines, how they behave, and how they change paths and layout or embedment regions. The general pattern was repetitive, but there were some differences which are a reflection of the local effects from which the measurement was taken. These effects are developed from mechanical malfunction(s) in some areas in the machine.
In this study our attention will be on the temperature distribution in the escalator gearbox, see Figure 1. Motor gearboxes are used to drive a machine like an escalator. The function of the gearbox is to transmit mechanical power from the motor through the gearbox to the escalator top drive shaft. A gearbox consists of a worm shaft (drive/input shaft), a newel wheel sprocket, and then the output shaft. Using a prognostic technique to monitor and study the behavior of a gearbox can be a useful tool in achieving maximum efficiency from the gearbox.
The behavior of a complex system like a compressor has been monitored and looked at by many studies [10-13]. The raw-measured signals were used for fault diagnosis. Research concerning the modelling of reciprocating compressors uses phase space trajectories, Poincare maps, and Lyapunov exponents for identifying the chaotic behavior of a reciprocating compressor system with subsidence rub-impact fault [14,15].
Nonlinear and chaotic dynamical systems can be analyzed by using tools like the phase space diagram and Poincare plot [16]. The Poincare map has been used for visualizing the nonlinear chaotic behavior of faults in gears and bearing elements [16].
This study will give an insight into behavior and pattern of operation of the escalator gearbox during normal and abnormal conditions.
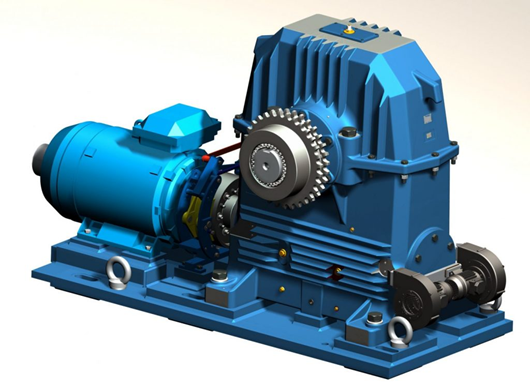
Figure 1 Shows the escalator motor gearbox with the distribution of temperature sensors.
Constructing the Map
Temperature sensors were distributed at different locations on the gearbox, as shown in Figure 1. The data/traces were logged into a data logger, see Figure 3, and then downloaded on a computer for analysis. The period of the run was divided into two regions, region 1 and region 2. Region 2 includes a shutdown period, to impose a stage of variation in the measurements. It is our intention to see whether the adopted technique in this study, will or will not detect this variation.
The Poincare space map and the phase plane map for the nonlinear behaviour of a machine like an escalator have been constructed using the traces from the temperature sensors. The Poincare space map is constructed by using the pseudo-phase plane method (also called the embedding space method). For one degree of freedom system with measurement x(t), one plots the signal versus itself but delayed or advanced by fixed time constant [x(t), x(t+T)]. The idea is that the signal x(t+T) is related to x`(t) and should have property similar to those in the classic phase plane [x(t), x`(t)]. If the motion is chaotic, the trajectories do not close.
When the state variables are greater than three (position, velocity, time or any other parameter), the higher-dimensional pseudo-phase-space trajectories can be constructed using multiple delays. For example, a three-dimensional space can be constructed using a vector with components (x(t), x(t+T), x(t+2T)) [1].
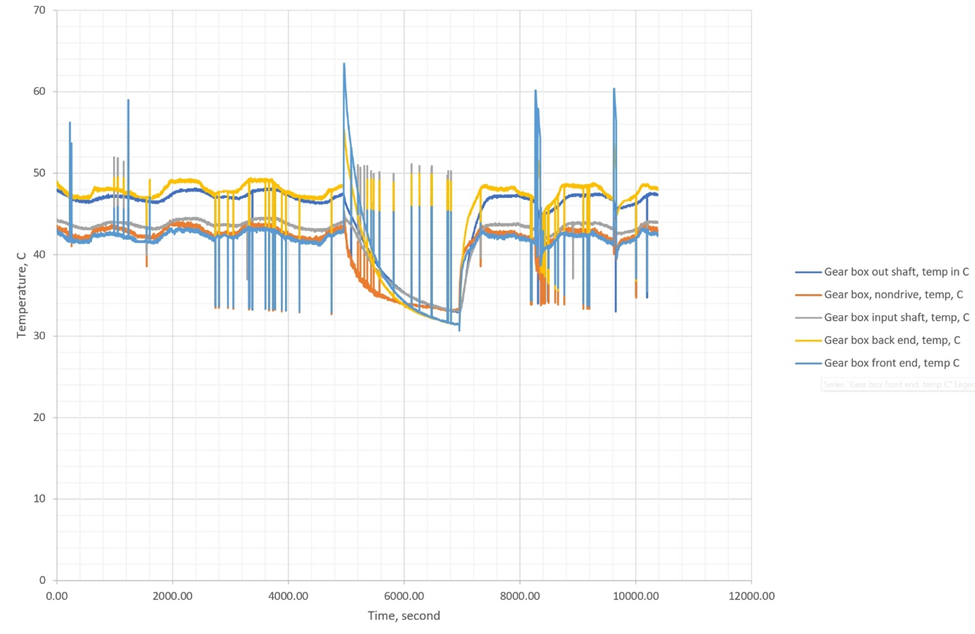
Figure 2 Presents the temperatures against the running time.
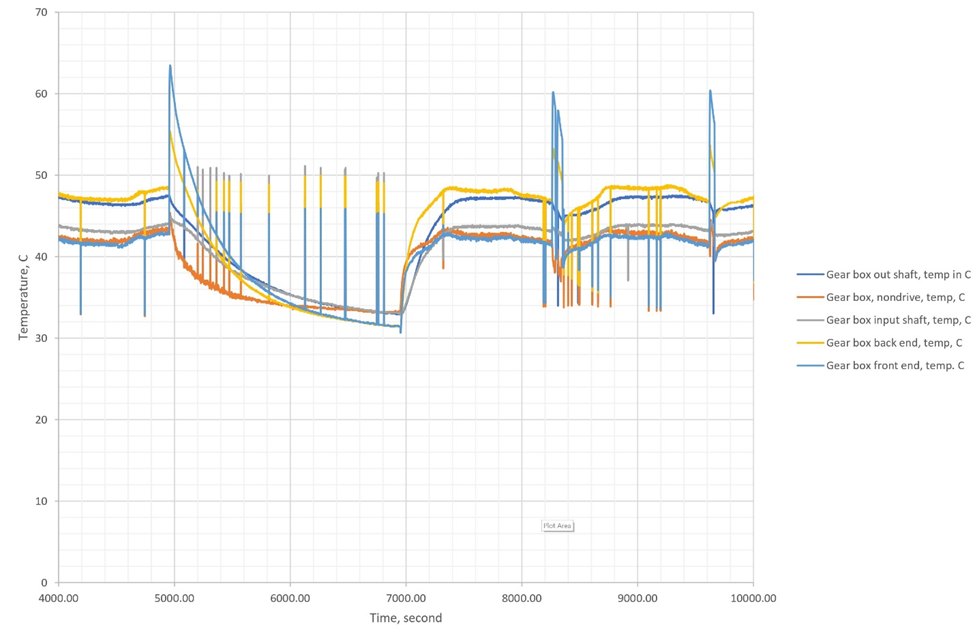
Figure 3a A magnification view for region 1 (0-4000 second) in Figure 2.
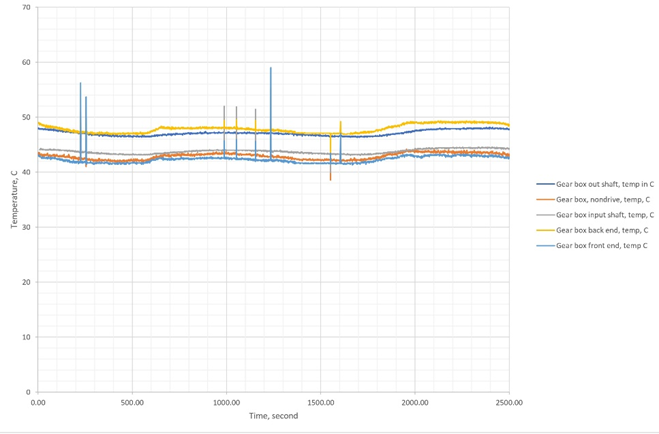
Figure 3a A magnification view for region 1 (4000-10000 second) in Figure 2.
Results and Discussion
Figures 4 to 13 show plots for the Poincare section and the phase plan map for each trace. It is very interesting and attention-grabbing to observe that the patterns and shape of the plots are very regular and systematic in the running period 0.0-4000s, region 1. However, the data in region 2, shows a different systematic pattern to those observed in the first period. They are for sure not chaotic, but periodic forming different loops ( periodic behaviours), which reflect the variation that happened in the escalator during the shutdown period.
Conclusions
This study has proven, that the phase plane map and the Poincare section are interesting tools to be used to monitor the behaviour of gearboxes. Beautiful and interesting patterns were developed in the maps and sections of temperatures measured from the gearbox. Variations in the behaviour of the gearbox temperature were noticed too, in the shape of other periodic patterns and shapes.
References
[1] A. Albadri. “Tube Lines Gets Smart to Monitor Escalator Wear,” Computer Weekly (07/01/2008).
[2] A. Albadri. “Smart Step Measures Escalators Heartbeats,” Elevator World UK, iss.104, 20/03/2020.
[3] A. Albadri. "Escalator Fractal Behavior (part 3), Elevator World Jan 2021.
[4] A. Albadri. "Smart Step Measures Escalator`s Heartbeat", Elevator World UK", March- April 2020.
[5] A. Albadri. "Escalator Fractal Behavior Elevator (Part 1), World Jun 2020.
[6] A. Albadri. "Escalator Fractal Behavior (part 2), World Jun 2020.
[7] A. Albadri. “The construction of Poincare Space Map and Phase Plane Map for Escalators (Part 1). To be published.
[8] A. Albadri. “The construction of Poincare Space Map and Phase Plane Map for Escalators (Part 2). To be published.
[9] A. Albadri. “The construction of Poincare Space Map and Phase Plane Map for Escalators (Part 3). To be published.
[10] Liu, Y; Yuan, Z; Wang, N; Zhao, J. “An Intelligent Fault Diagnosis Method for Reciprocating Compressors Based on LMD and SDAE”. Sensor, 2019, 19, 1041.
[11] Wang, Y; Gao, A; Zheng, S; Peng, X. “Experimental Investigation of the Fault Diagnosis of Typical Faults in Reciprocating Compressor Valves”. Proc. Inst. Mech. Eng. Part C J. Mech. Eng. Sci. 2016, 230, 2285-2299.
[12] Aravinth, S; Sugumaron, V. “Air Compressor Fault Diagnosis Through Statisical Feature Extraction & Random Forest Classifiers”. Prog. Ind. Ecol. Int. J. 2018, 12 192-205.
[13] Xiao, S; Liu, S; Jiang, F; Song, M: Cheng, S. “Nonlinear Dynamic Response of Reciprocating Compressor System with Rub-Impact Gault Caused by Subsidence”. J. Vib. Control., 2019, 25, 1737-1751.
[14] Xiao, S; Zhang, H; Liu, S, Jiang, F; Song, M. “Dynamic Behavior Analysis of Reciprocating Compressor with Subsidence Fault Considering Flexible Piston Road”. J. Mech. Sci. Technol. 2018, 32, 4103-4124.
[15] Tufillaro, N B, Abbott, T, Reilly, J. “An Experimental Approach to Nonlinear Dynamics and Chaos”. Addison – Wesley; Redwood City, CA, USA, 1922.
[16] Soleimani A; Kadem, S “Early Fault Detection of Rotating Machinery Through Chaotic Vibration Feature Extraction of Experimental Data Sets”. Chaotic Solutions Fractals 2015, 78, 61-75.
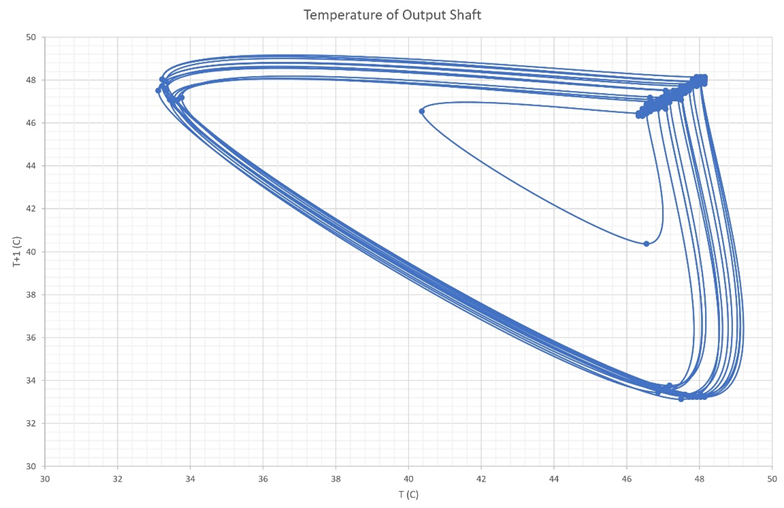
Figure 4a Shows the Poincare section for output gear box shaft between 0.0-4000 second.
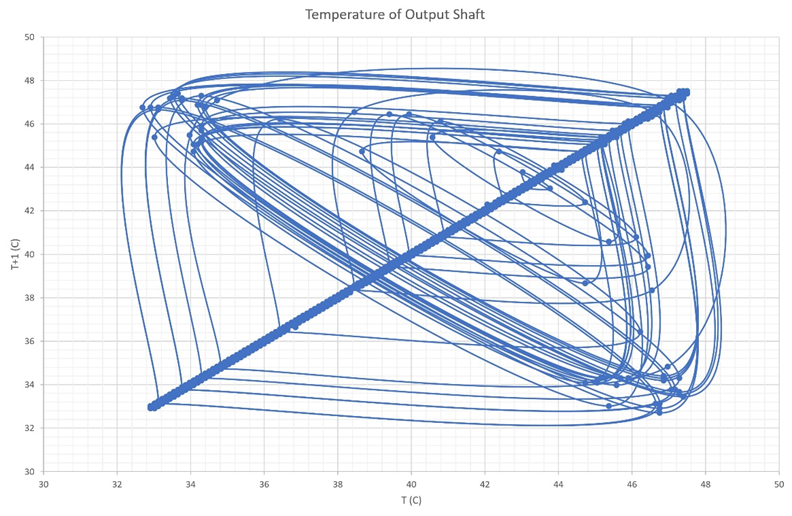
Figure 4b Shows the Poincare section for the output gear box shaft between 4000-10,000 second.
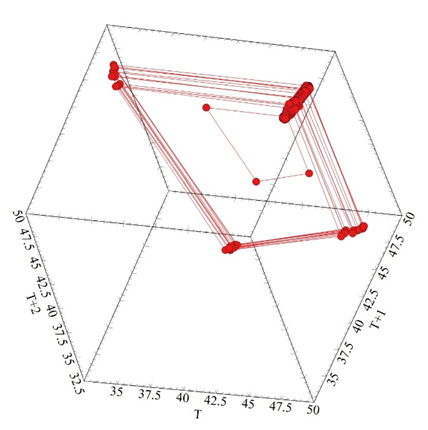
Figure 5a Shows the Phase Plan Map for the output gearbox shaft between 0.0-4000 seconds.
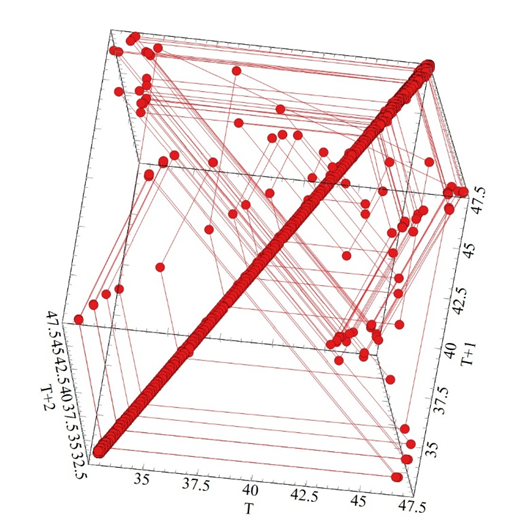
Figure 5b Shows the Phase Plan Map for the output gearbox shaft between 4000-10,000 seconds.
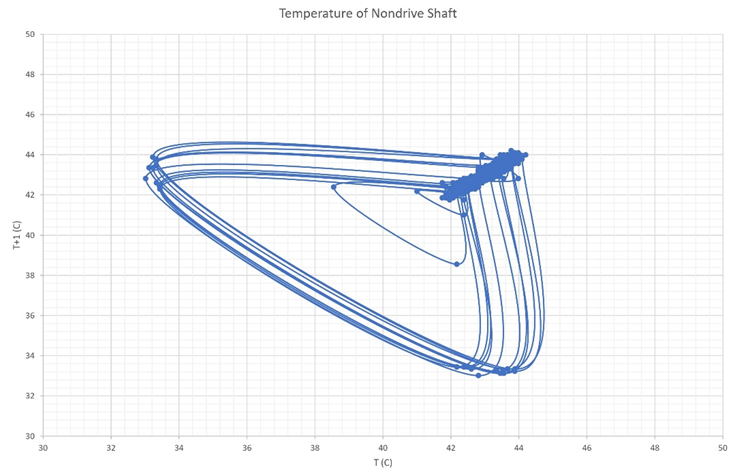
Figure 6a Shows the Poincare section for the non-drive gearbox shaft between 0.0-4000 seconds.
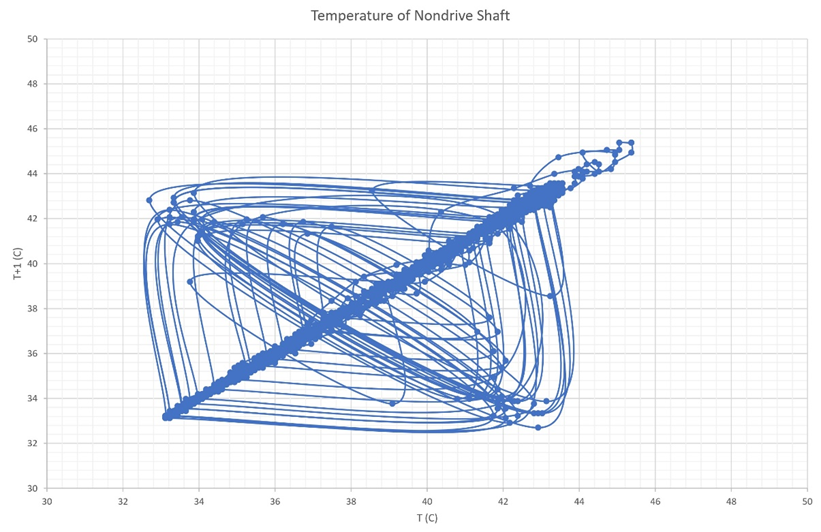
Figure 6b Shows the Poincare section for the non-drive gearbox shaft between 4000-10000 seconds.
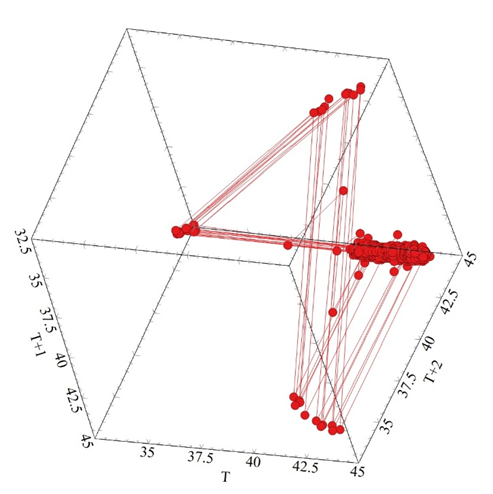
Figure 7a Shows the Phase Plan Map for the non-drive gear box shaft between 0.0-4000 seconds.
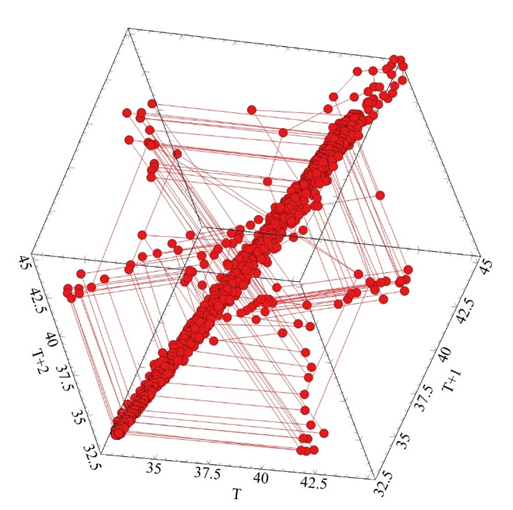
Figure 7a Shows the Phase Plan Map for the non-drive gearbox shaft between 4000-10000 second.
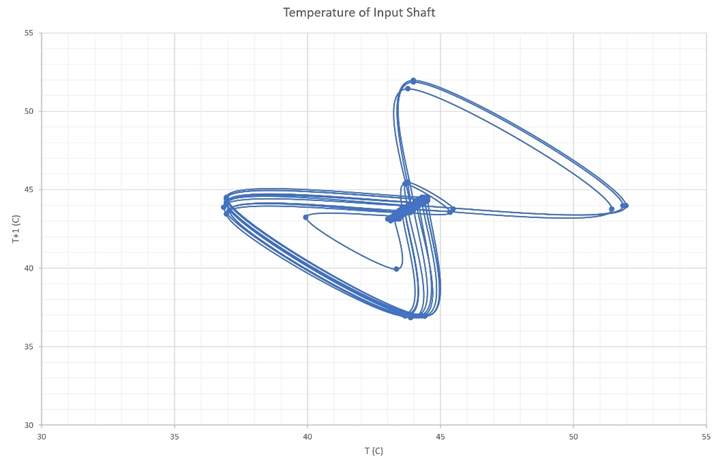
Figure 8a Shows the Poincare section for the input gearbox shaft between 0.0-4000 seconds.
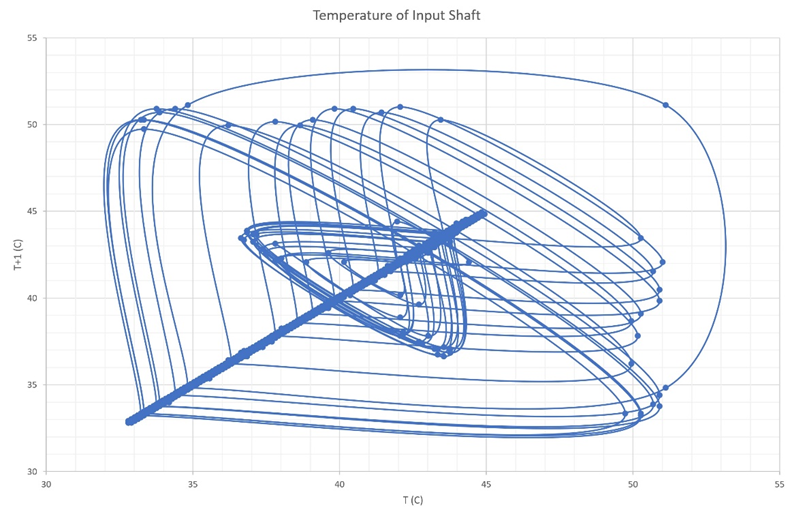
Figure 8b Shows the Poincare section for the input gearbox shaft between 4000-10000 seconds.
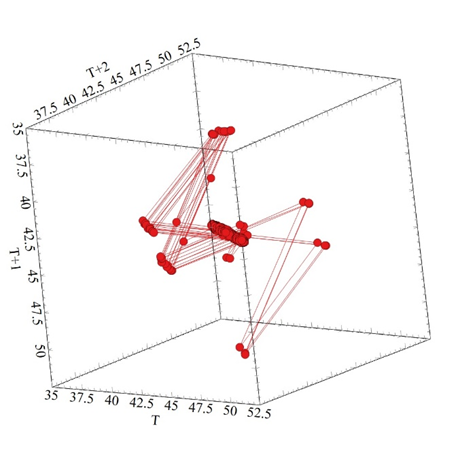
Figure 9a Shows the Phase Plan Map for the input gearbox shaft between 0.0-4000 seconds.
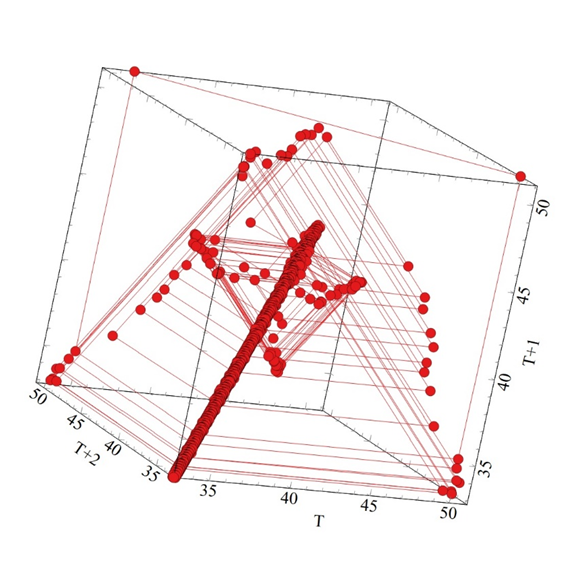
Figure 9a Shows the Phase Plan Map for the input gearbox shaft between 4000-10000 seconds.
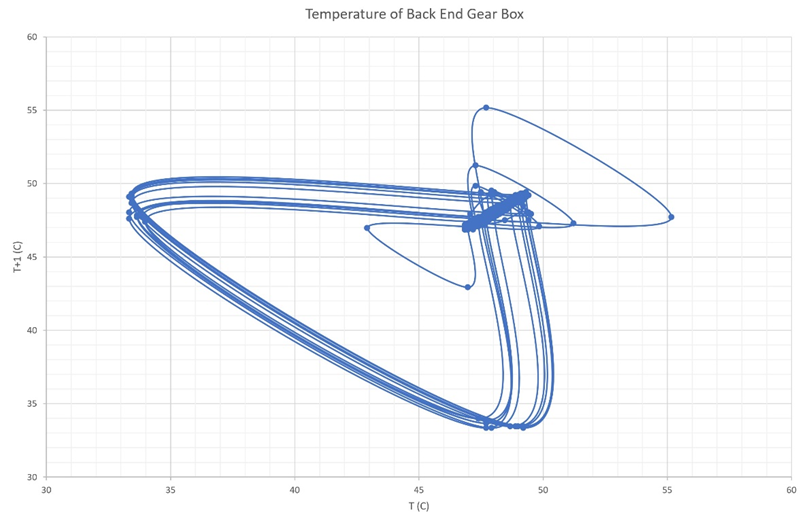
Figure 10a Shows the Poincare section for the back-end gearbox shaft between 0.0-4000 seconds.
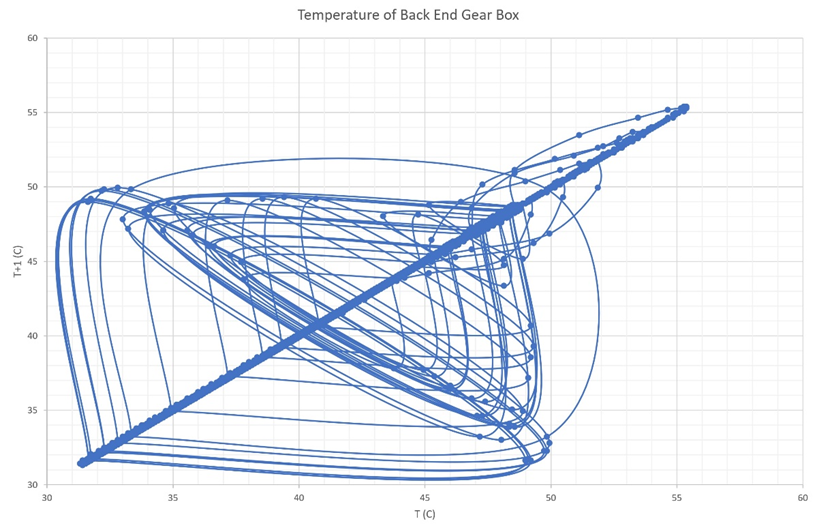
Figure 10b Shows the Poincare section for the back-end gearbox shaft between 4000-10000 seconds.
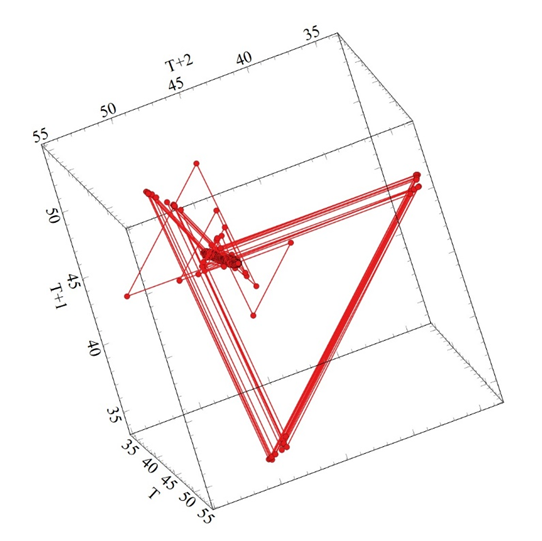
Figure 11a Shows the Phase Plan Map for the back-end gearbox shaft between 0.0-4000 seconds.
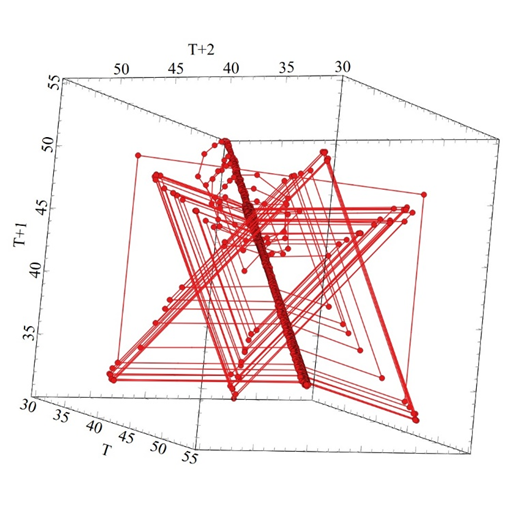
Figure 11a Shows the Phase Plan Map for the back-end gearbox shaft between 4000-10000 seconds.
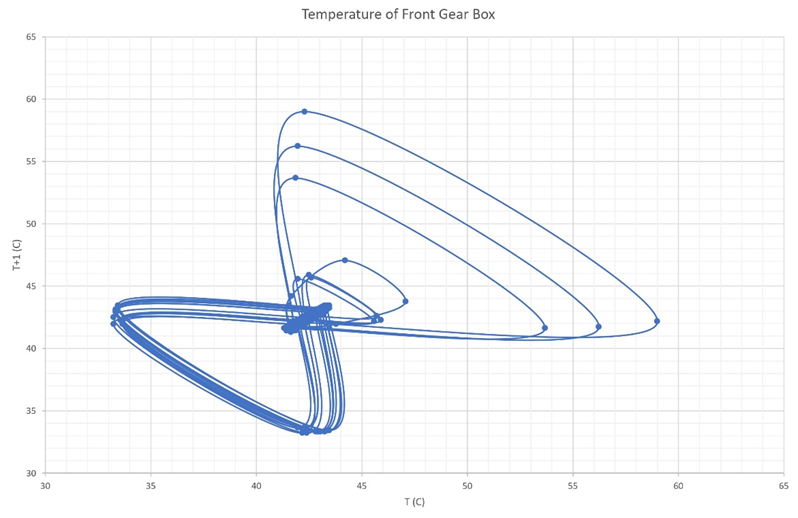
Figure 12a Shows the Poincare section for the front-end gearbox shaft between 0.0-4000 seconds.
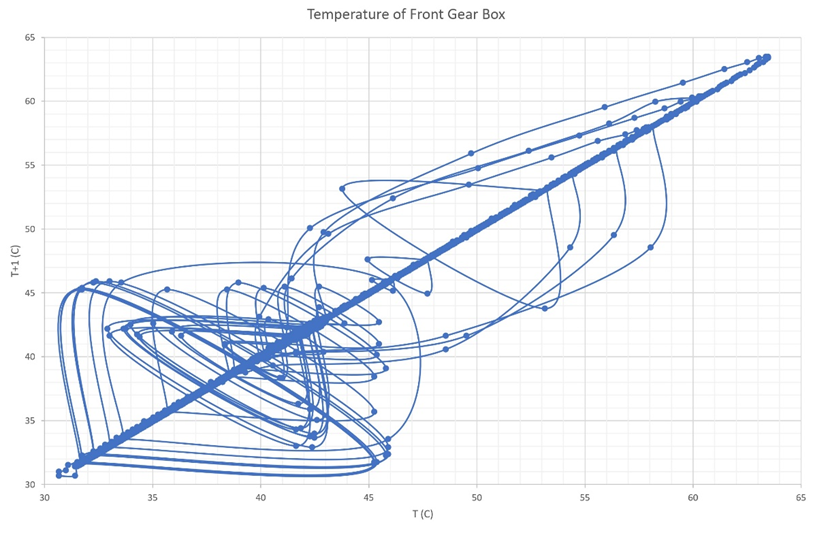
Figure 12b Shows the Poincare section for the front-end gearbox shaft between 4000-10000 seconds.
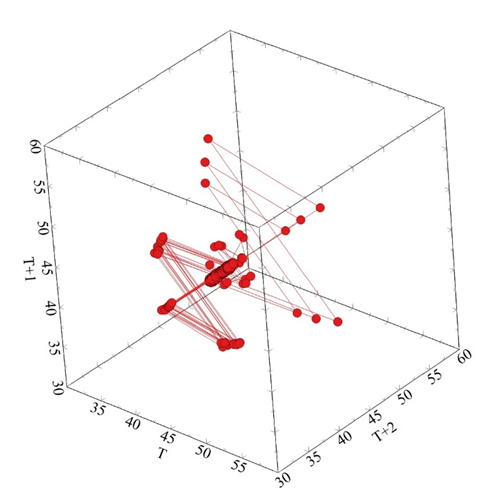
Figure 13a Shows the Phase Plan Map for the front-end gearbox shaft between 0.0-4000 seconds.
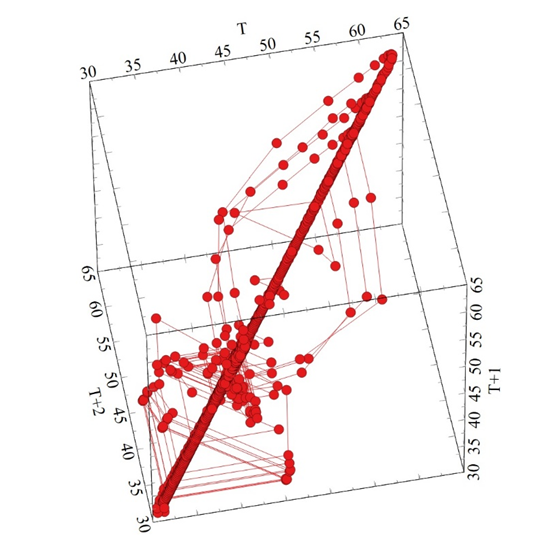
Figure 13a Shows the Phase Plan Map for the front-end gearbox shaft between 0.0-4000 seconds.

Explore EMS
More Editorial
Directory
This website is owned and operated by: MSL Media Limited
Co. Number: 05359182
© 2005 MSL Media Ltd. All rights reserved. E&OE