Condition Monitoring/Predictive Maintenance - Statistics
Temperature Fractal and Nonlinear Behavior for Escalators
by Dr. Ali Albadri
Measuring the behavior of an escalator from measured signals collected from various parts of the machine is an interesting and useful concept. Behavior of an escalator can be measured by using the smart step. The smart step measures the fingerprint or the heartbeat of the machine. Any anomalies in the behavior of the escalator, such as developing a mechanical failure, will be shown in the traces for the heartbeat.
We established in our previous studies that the heartbeat of an escalator has fractal characteristics [1-6]. The heartbeat of the escalator can be translated to a single value in form of the fractal dimension. It is a detection technique, which can detect the health and fitness of the machine. The principle of this work is not limited to escalator; it can be applied to any electro-mechanical machine.
This study will look into the behavior of temperature distribution in a gearbox for an escalator. It asked and answered the following questions.
- Does the temperature of escalator gear box have fractal behavior or characteristics?
- Can the fractal behavior of the gear box be quantified?
- Would the value of the fractal dimension for the gear box give an insight into the mechanical behavior of the escalator? Such as disclosing potential of failures and malfunctions.
Introduction
We have proven that the smart step can measure the heartbeat of the escalator [1]. The heartbeat can be translated to single value in shape of the fractal dimension, Df [2-6]. The values of the fractal dimension were measured by measuring the stresses levels in different locations in the smart step [2-6]. These values can be used as an indicator to the operation quality of the machine. They can also predict potential failures in the escalator.
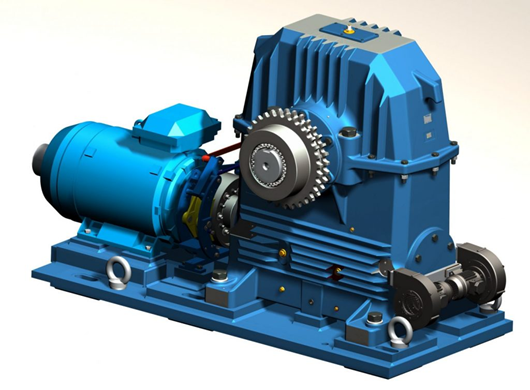
In this study our attention will be to the temperature distribution in the escalator gear box, see Figure 1. Although nonlinear behavior of machines and their individual components have been studied [7], but to our knowledge there has never been a study similar to our approach in this study, therefore not many research are available to address the three questions we stated above.
Figure 1 Shows escalator motor gear box with the distribution of temperature sensors.
Temperature Data Collection
Temperature sensors were distributed at different location on the gear box, as shown in Figure 1. The data/traces were logged into a data logger, see Figure 2, then downloaded to a computer for analysis. The period of run was divided into two regions, region 1 and 2. Region 2 includes a shutdown period, to impose a stage of variation in the measurements. It is our intention to see whether the adopted technique of determining the fractal dimension, will or will not detect this variation.
Methodology Used to Ddetermine Dr (Fractal Dimension)
The step technique has been used here to determine Df. A computer program was written in Microsoft Excel to determine Df and plot the data. Our methodology is very similar to the Multiresolution Length Method, which has been used by many researchers [8-10].
The steps in the time series = s = {s(0), s(1), s(2), s (3), . . .s(n)} of length n of the trance. Each point in the plot is represented in (xi, yi) when i = 1, 2, 3, . . .n. xi values are abscissa, and yi values are ordinate values. The Euclidean distance between two points (x1, y1) and (x2, y2) is:
dist(s1, s2) = ((x1 - x2)2 + (y1 - y2)2)0.5 (1)
The total length of the curve of the first-time resolution is calculated as:
L = I = 1∑n - 1 dist(si, si + 1) (2)
It is noted that, as the resolution becomes coarser, the estimated length of the time series becomes less accurate. Repeat the above for different resolutions, (r = r1, r2, r3, r4, . . .rp, where rp is the maximum coarsest resolution at which the length of the curve is calculated.
By drawing a log-log graph (1/rk) versus (Lr) and compute the slope, the fractal dimension is calculated from:
(Df - 1) = -[log(Lr)/log(1/rk)] = -[slope] (3)
Temperature distribution sensors were located at different places on an escalator gear box, see Figure 1.
Figure 2 shows the traces of temperature against the running time for the escalator.
Figure 3 presented a magnification view to regions 1 and 2, shown in Figure 2.
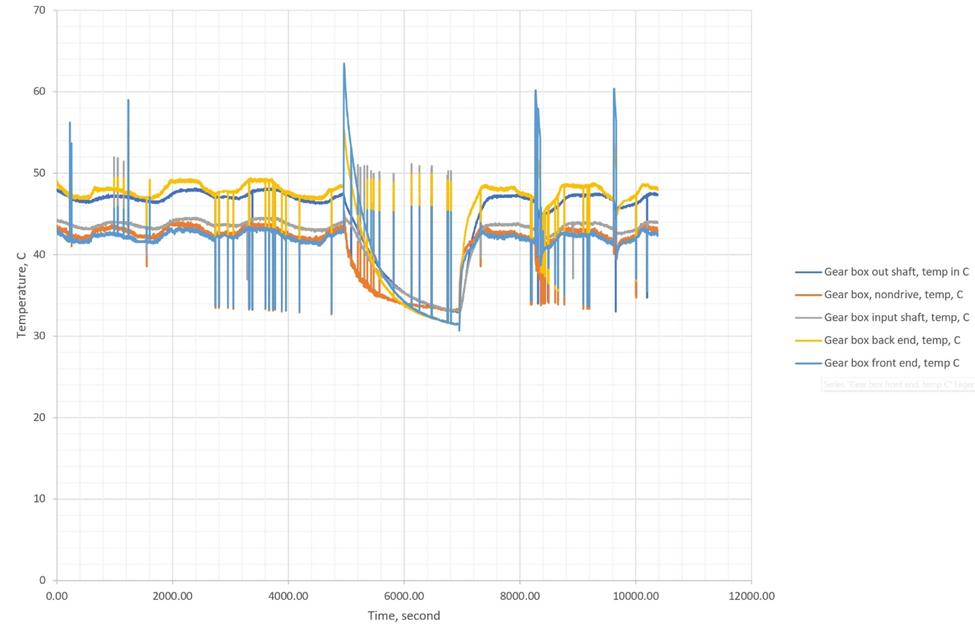
Figure 2 Presents the temperatures against the running time.
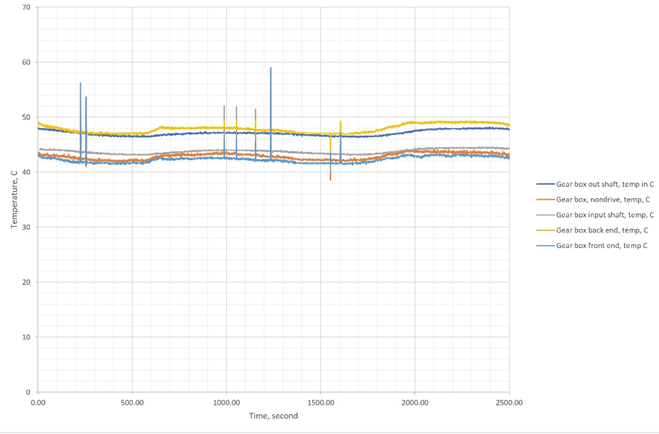
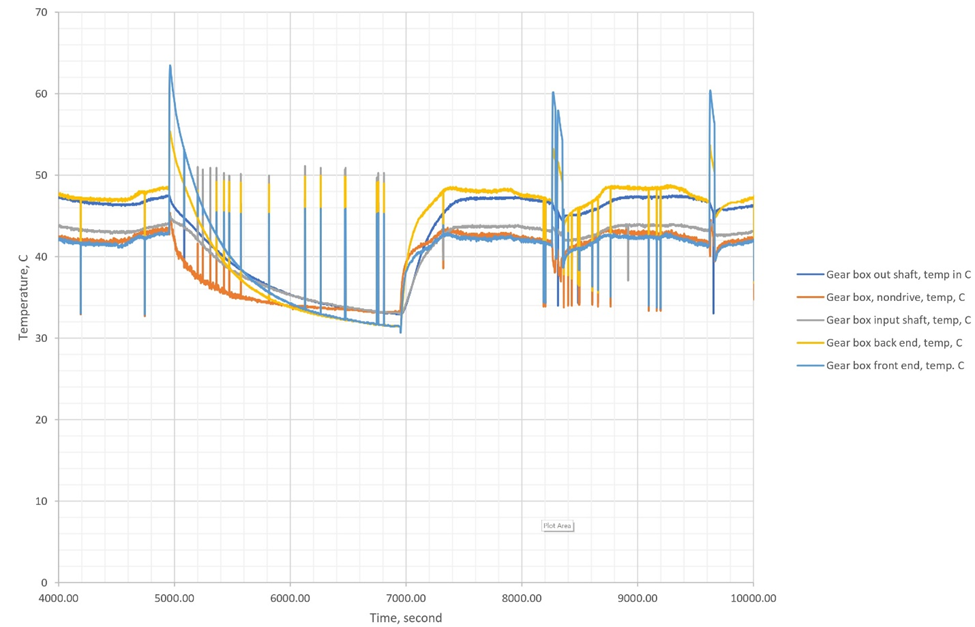
Figure 3a A magnification view for region 1 (0-4000 second) in Figure 2.
Figure 3a A magnification view for region 1 (4000-10000 second) in Figure 2.
Results and Discussion
Table 1 and Figures 4, 5, 6, 7, and 8 present the fractal dimension values for the traces of the measured temperatures, from different locations in the gear box. The roughness of the traces in Figure 3 shows that, in general they are smooth, except some drops out in the signals. Table 1 lists the estimated fractal dimension values for the traces. The values reconfirm that all of the traces are smooth, except there is a very small variations, which could have been developed as result of the drops out. The period between 4000-10,000 second has shown higher fractal dimension values than the period 0.0-4000s, this could be due to the escalator shut down, shown in Figure 2.
|
No |
Temperature Trace Type |
Fractal Dimension value, Df (0.0-4000s) |
Fractal Dimension value, Df (4000-10000s) |
|
1. |
Output gear box shaft |
1.0015 |
1.0018 |
|
2. |
Nondrive gear box shaft |
1.0018 |
1.0021 |
|
3. |
Input gear box shaft |
1.0017 |
1.002 |
|
4. |
Back gear box shaft |
1.0014 |
1.0021 |
|
4. |
Front End gear box shaft |
1.0017 |
1.002 |
Conclusions
The roughness and smoothness of temperature traces, which are measured from an escalator gear box, can be quantified in form of fractal dimension values. They can be used to monitor and obverse the behaviour of the gear box during its daily operation. One or two sensors are more than enough to show the overall behaviour of the gear box during operation. This could have significant advantages such as:
- Monitoring the performance of the gear box by defining trends.
- Improve maintenance plans by knowing the right time for maintenance and by allocating the right men power.
- The fractal dimension values which are measured for the gear box can be connected with the fractal dimension values of measured from other parts and assemblies of the escalator, this can be used to deduce the interaction relationships in the behaviour of the gear box and other components/assemblies in the machine.
- The principles and implications of the technique used in this study can be used in any mechanical system, other than escalators.
Figure 4a Estimation of the fractal dimension for the temperature trace at the output gear box shaft between 0.0-4000 second.
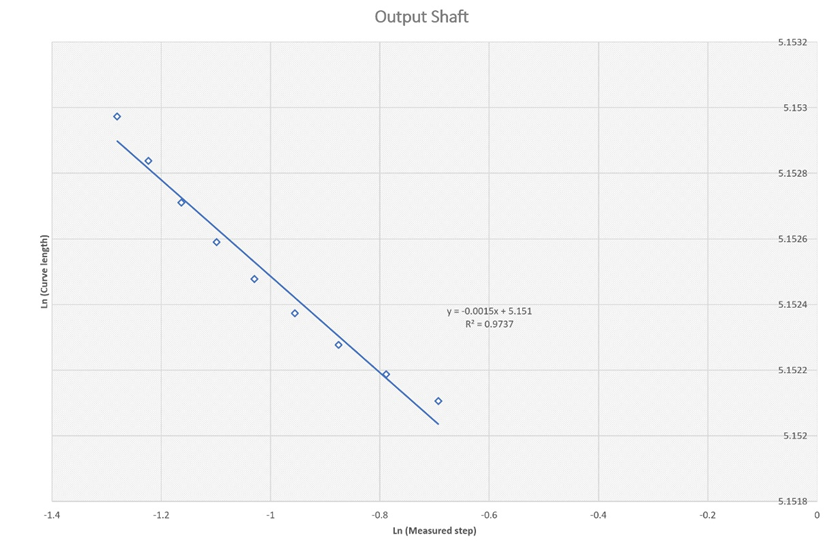
Figure 4b Estimation of the fractal dimension for the temperature trace at the output gear box shaft between 4000-10,000 second.
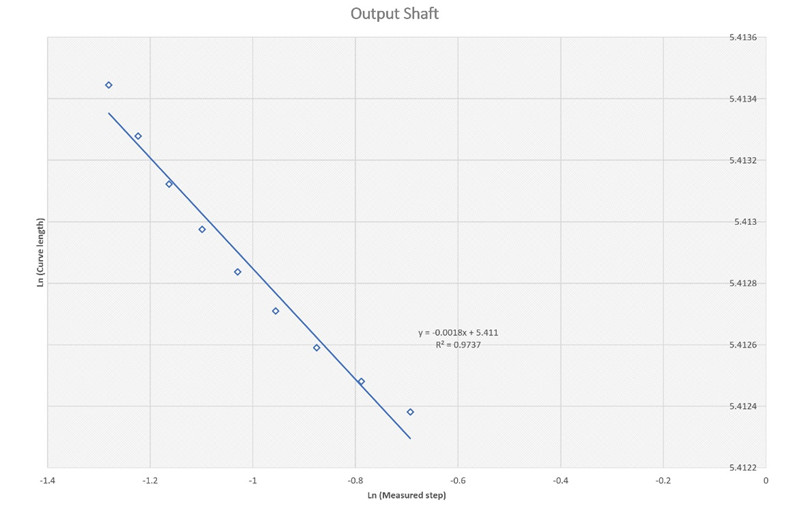
Figure 5a Estimation of the fractal dimension for the temperature trace at the nondrive gear box shaft between 0.0-4000 second.
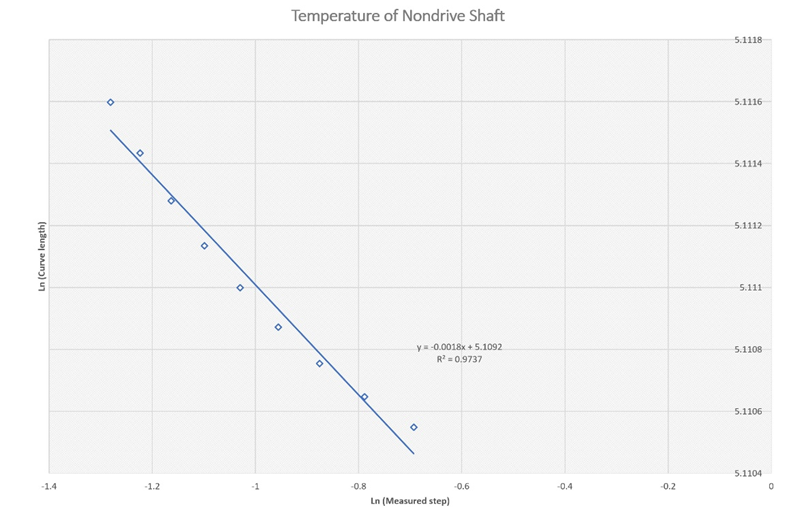
Figure 5b Estimation of the fractal dimension for the temperature trace at the nondrive gear box shaft between 4000-10000 second.
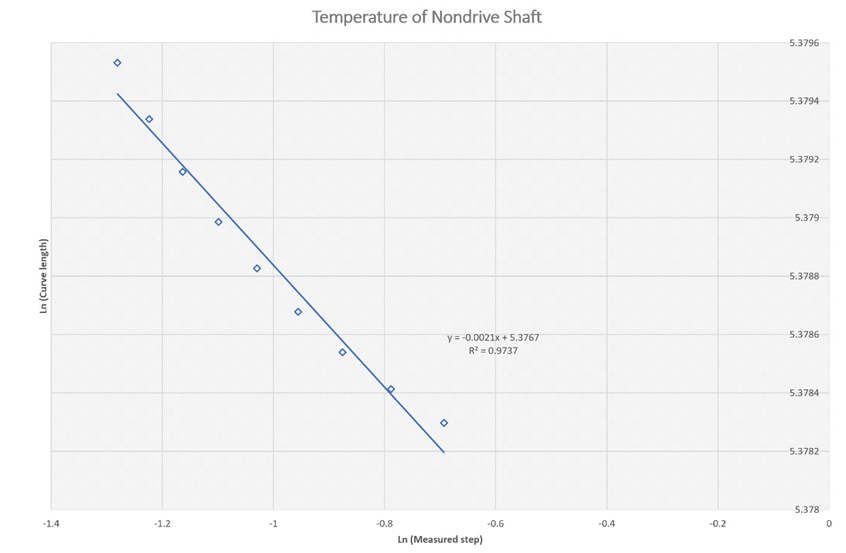
Figure 6a Estimation of the fractal dimension for the temperature trace at the input gear box shaft between 0.0-4000 second.
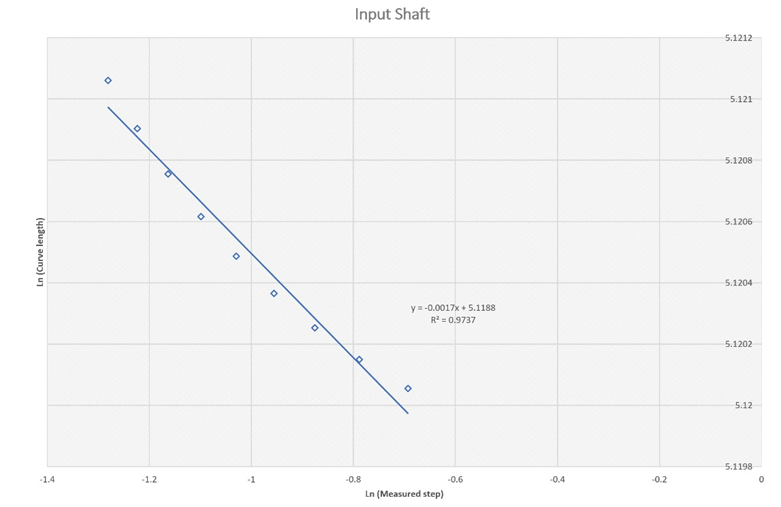
Figure 6b Estimation of the fractal dimension for the temperature trace at the input gear box shaft between 4000-10000 second.
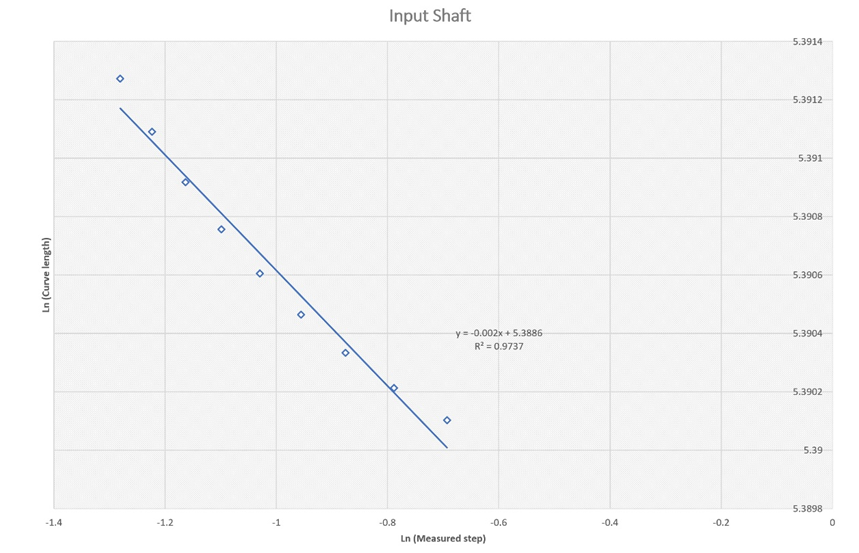
Figure 7a Estimation of the fractal dimension for the temperature trace at the back-end gear box shaft between 0.0-4000 second.
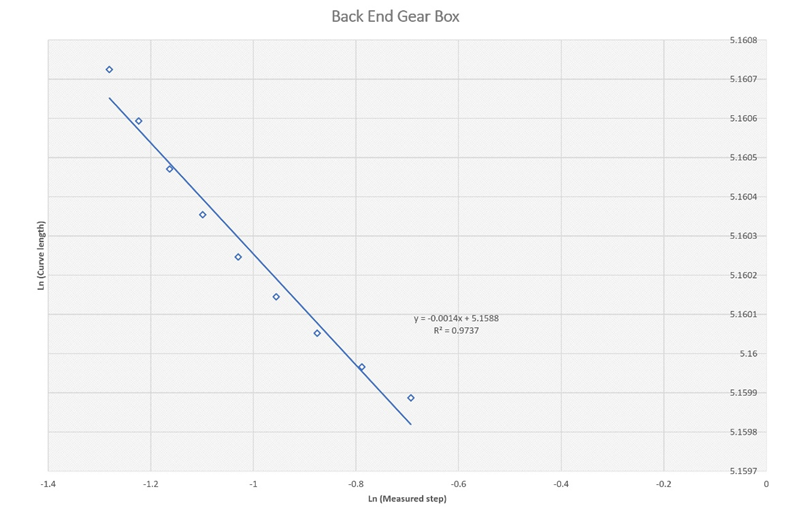
Figure 7b Estimation of the fractal dimension for the temperature trace at the back-end gear box shaft between 4000-10000 second.
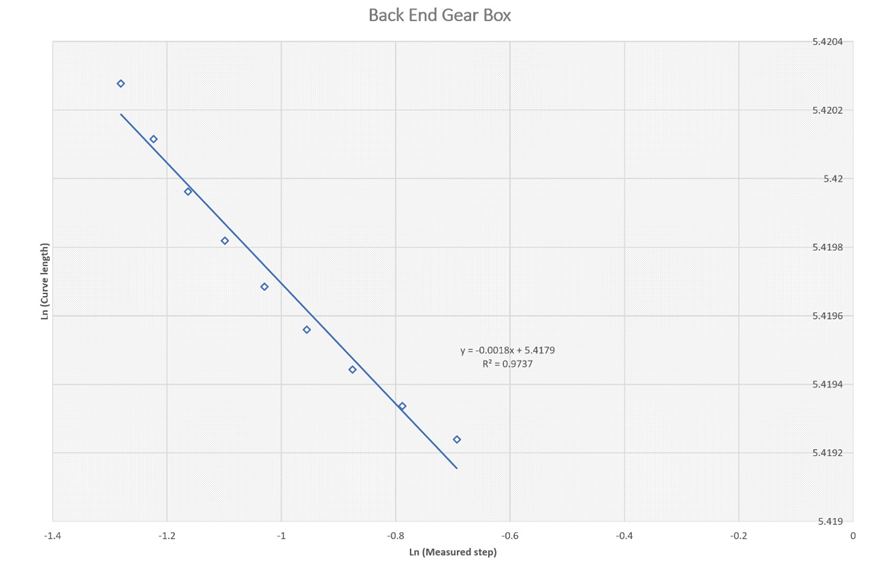
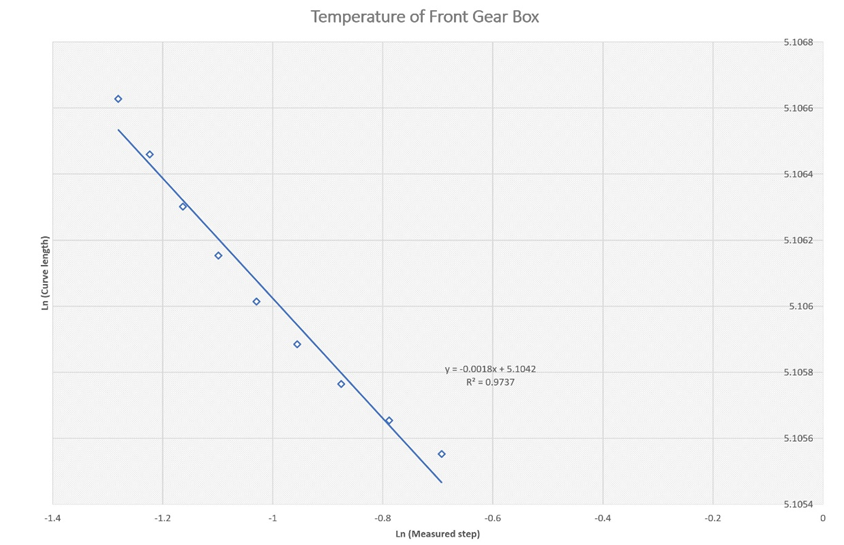
Figure 8a Estimation of the fractal dimension for the temperature trace at the front-end gear box shaft between 0.0-4000 second.
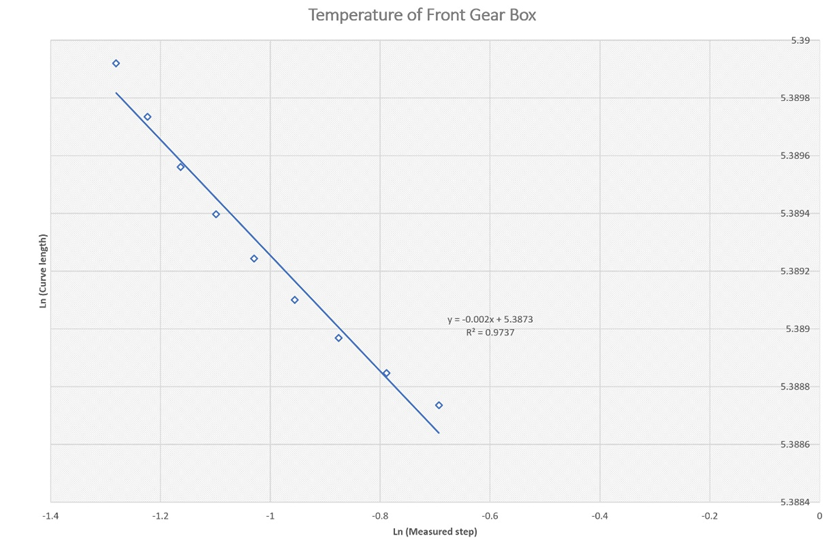
Figure 8b Estimation of the fractal dimension for the temperature trace at the front-end gear box shaft between 4000-10000 second.
References
[1] A. Albadri. “Tube Lines Gets Smart to Monitor Escalator Wear,” Computer Weekly (07/01/2008).
[2] A. Albadri. “Smart Step Measures Escalators Heartbeats,” Elevator World UK, iss.104, 20/03/2020.
[3] A. Albadri. "Escalator Fractal Behavior (part 3), Elevator World Jan 2021.
[4] A. Albadri. "Smart Step Measures Escalator`s Heartbeat", Elevator World UK", March- April 2020.
[5] A. Albadri. "Escalator Fractal Behavior Elevator (Part 1), World Jun 2020.
[6] A. Albadri. "Escalator Fractal Behavior (part 2), World Jun 2020.
[7] Francis C. Moon, “Dynamics and Chaos in Manufacturing Processes,” Wiley Series in nonlinear science, 1998.
[8] B.S. Raghavendra and D. Narayana Dutt. “Computing Fractal Dimension of Signals Using Multiresolution Box-Counting Method,” World Academy of Science, Engineering and Technology 37 (2010).
[9] D. Scheianu and I. Tutanescu. “Application of Fractal Signal,” University of Piesti, Communication and Computer Department.
[10] A. Zlatintsi and P. Maragos, “Multiscale Fractal Analysis of Musical Instrument Signals With Application to Recognition,” IEEE Transaction on Audio, Speech and Processing, Vol. 21, no. 4 (April 2013).

Explore EMS
More Editorial
Directory
This website is owned and operated by: MSL Media Limited
Co. Number: 05359182
© 2005 MSL Media Ltd. All rights reserved. E&OE