 Ernesto Wiedenbrug, Ph.D.
Description:
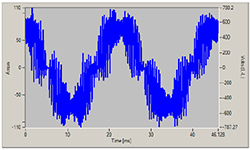
The voltage waveform to the left in Fig 1 looks normal, but at another point in time it looks like the waveform to the right of Fig. 1; where the waveform stays constant on the top and the bottom. What is going on? Is this a problem?
Fact:
VFDs don’t only change the frequency of the voltage, but also the voltage level in proportion with the frequency.
Comparing the frequencies:
Both plots show two complete cycles for the voltage waveforms; the one to the left takes 46.1ms for two cycles – which means 43.4Hz, and the one to the right takes only 41.7ms, which means that the VFD is running at 48Hz. According to the Volts per Hertz control technique [1], this means that the VFD output voltage needs to be almost 10% higher for the waveform to the right.
To continue reading the full case study, with images, please download the free PDF file here.
http://csaanalysis.com/PDFS/FAQ%20-%20what%20does%20it%20mean%20if%20the%20voltage%20waveform%20generated%20by%20a%20VFD%20has%20'flat%20spots'.pdf
To contact Whitelegg direct please visit http://www.whitelegg.com
